在 leaflet 加载 flask 后台数据 (1)
webgis 2020-02-02
python
flask
leaflet
因为前期项目一个小的需求,需要将已有的 wkt 数据在地图上叠加显示。处理的方式有很多,但是都感觉不是特别方便。因为在之前看到过有类是的在线处理工具,如 geosjon 生成工具和图层简化工具等,加上前段时间学习了 flask,python 开发 web 的框架,所以想着集合 flask 、gdal 和 leaflet 做一个 web 端的转换工具;
# 环境搭建
- python 环境:利用 anaconda 管理工具,python 版本 3.6,flask 等插件直接通过 anaconda 下载
- gdal:通过 anaconda 工具直接下载或者 conda install gdal
- 地图:leafletjs 最新版本
- UI:直接使用的 bootstrap
- 开发工具:pycharm
# 创建项目
- 直接通过 pycharm 新建项目,选择 flask,修改项目文件路径,然后配置 Python 环境,最后点击创建

- 引入 web 端 jsapi
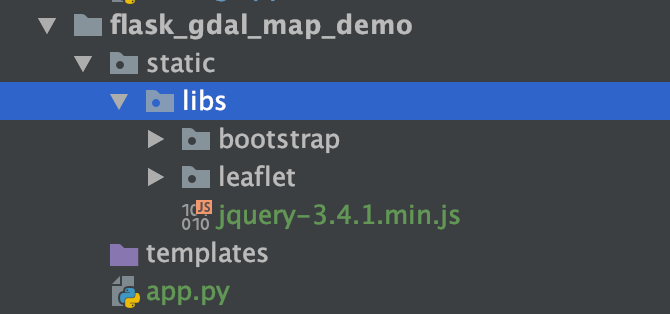
- 创建 web 页面 引入 js 和 css 文件
<link rel="stylesheet" href="{{ url_for('static',filename='libs/bootstrap/css/bootstrap.css') }}" />
<link rel="stylesheet" href="{{ url_for('static',filename='libs/leaflet/leaflet.css') }}" />
<link rel="stylesheet" href="{{ url_for('static',filename='css/index.css') }}" />

<script src="{{ url_for('static',filename='libs/leaflet/leaflet.js') }}"></script>
<script src="{{ url_for('static',filename='libs/bootstrap/js/bootstrap.js') }}"></script>
<script src="{{ url_for('static',filename='libs/jquery-3.4.1.min.js')}}"></script>
1
2
3
4
5
6
7
2
3
4
5
6
7
# 初始化地图
var map;
function initMap() {
	map = L.map('map', {
		center: [30.66655, 104.067108],
		zoom: 10,
	});
	addBaseLayer();
}

function addBaseLayer() {
	var option = {
		maxZoom: 17,
		minZoom: 1,
		subdomains: ['0', '1', '2', '3', '4', '5', '6', '7'],
		attribution: "<a target='_blank' href='https://www.tianditu.gov.cn/'>天地图</a> ",
	};
	L.tileLayer(
		'https://t{s}.tianditu.gov.cn/vec_w/wmts?SERVICE=WMTS&REQUEST=GetTile&VERSION=1.0.0&LAYER=vec&STYLE=default&TILEMATRIXSET=w&FORMAT=tiles&TILEMATRIX={z}&TILEROW={y}&TILECOL={x}&tk=天地图key',
		option
	).addTo(map);
	L.tileLayer(
		'https://t{s}.tianditu.gov.cn/cva_w/wmts?SERVICE=WMTS&REQUEST=GetTile&VERSION=1.0.0&LAYER=cva&STYLE=default&TILEMATRIXSET=w&FORMAT=tiles&TILEMATRIX={z}&TILEROW={y}&TILECOL={x}&tk=天地图key',
		option
	).addTo(map);
}
1
2
3
4
5
6
7
8
9
10
11
12
13
14
15
16
17
18
19
20
21
22
23
24
25
2
3
4
5
6
7
8
9
10
11
12
13
14
15
16
17
18
19
20
21
22
23
24
25
# 选中 app.py 右键运行
